Example #1: HOBr -> HBrO
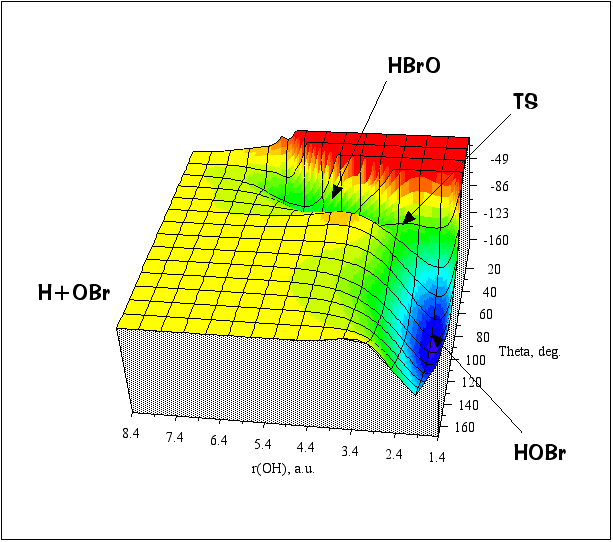
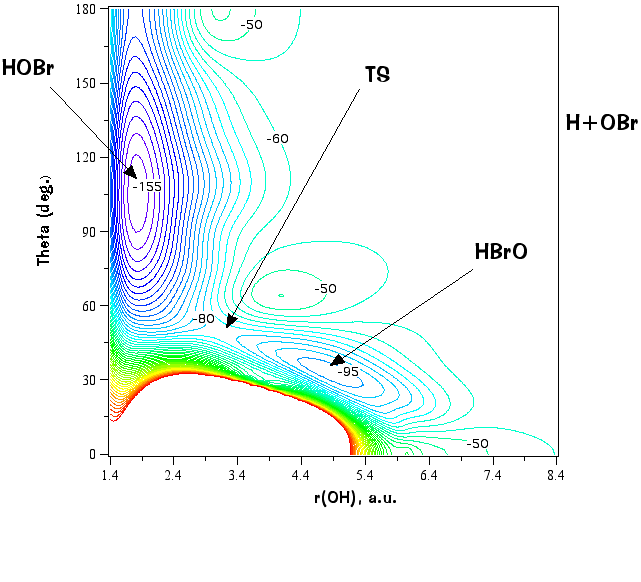
2 minima and 1 isomerization transition state
note - there are 3n-6 = 3 degrees of freedom, so we already have to chose which 2 coordinates to view at one time
(2 internal coordinates + the potential energy). The figures below are for fixed r(BrO) = 3.34 a.u. Consider that to
generate the full global potential energy surface for this system from which these cuts were extracted required over
1,000 separate ab initio calculations (one per nuclear arrangement) !
Surface plot (energy in kcal/mol relative to a zero of energy at the H+O+Br asymptote):

As you can tell, visualizing potential energy surfaces by these types of plots are very dependent on the viewing angle and
are not very convenient (but sometimes look cool). A more quantitative method is to use contour plots:


